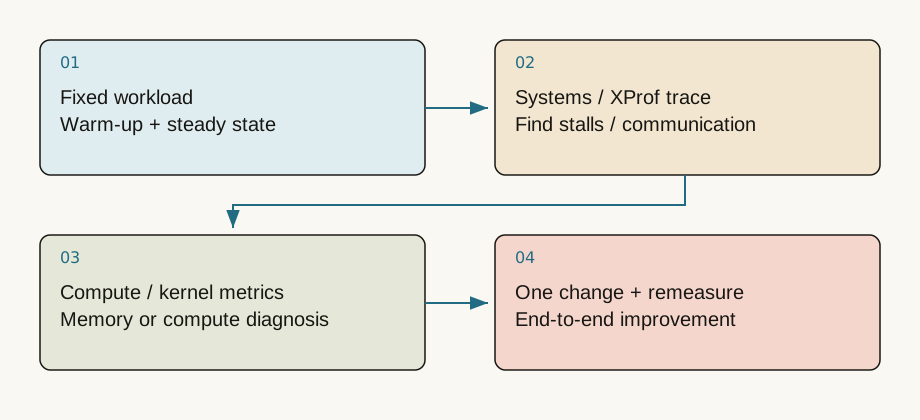
A complete explanation from first principles
Profiling should produce a falsifiable explanation
Low GPU utilization does not by itself justify a faster GPU. The device might wait for data, another rank, CPU submissions or synchronization. A profiler separates observable events so you can identify computation and waiting on the critical path.
First specify the slow quantity: first token, inter-token gap, training step, data loading or checkpoint saving. The capture window must correspond to that question. One screenshot cannot answer every performance question.
Distinguish timelines from kernel counters
Nsight Systems helps relate CPU activity, GPU work, transfers and communication. Nsight Compute focuses on individual CUDA-kernel behavior. XProf provides execution and performance views for supported TPU/accelerator workloads, with available views depending on the environment.
Find the expensive region before examining its detailed counters. Halving a kernel that occupies one percent of runtime rarely transforms user experience. A small synchronization point, however, may block all subsequent work.
Calculate overlap instead of adding every bar
Suppose a step has twenty milliseconds of preparation, sixty of GPU compute and thirty of communication. Fully serial execution totals 110 milliseconds. If twenty milliseconds of communication overlap computation, the total may be ninety. Summing every timeline event double-counts overlapping intervals.
Shortening an operation completely hidden beneath other work may leave total runtime unchanged. Prioritize exposed critical-path time rather than cumulative category duration alone.
Asynchronous execution complicates timing
A GPU call may return after enqueueing work. A CPU timer around that call can therefore measure submission rather than completion. Synchronization or device events establish clearer boundaries, but added synchronization can change overlap. Inspect both controlled microbenchmarks and the actual execution path.
The first iteration may include compilation, allocation, initialization and cache population. Warm up when reporting steady state; retain those costs when studying cold start. Both are valid experiments if their meanings remain explicit.
Turn symptoms into a controlled next experiment
Long idle gaps suggest checking data loading, tokenization, scheduling or synchronization. Unequal rank arrival at a collective suggests load imbalance, varying sequence lengths or a straggler. High bandwidth use with low arithmetic utilization suggests reducing traffic or improving reuse.
These are hypotheses, not automatic conclusions from trace shapes. Change one major variable at a time and preserve comparable workloads and before/after captures.
Record the problem, baseline, hypothesis, intervention, correctness check, measured change and side effects. For example, investigate whether long prefill worsens decode-tail gaps by varying chunk size and checking both TTFT and ITL. That record is more useful than “twenty percent faster.” Profiling itself adds overhead, so confirm gains with a less intrusive benchmark. The browser notebook demonstrates repeated CPU timing; it does not simulate a real Nsight or XProf hardware capture.
First ask why the accelerator is idle
Nsight Systems examines CPU, CUDA and communication timelines. Nsight Compute investigates individual kernels. XProf provides accelerator analysis and traces, especially useful in XLA/JAX/TPU workflows. They operate at different levels. A low-utilization kernel alone cannot explain end-to-end latency.
Capture a representative steady-state window covering loading, tokenization, CPU dispatch, GEMMs, attention, collectives and synchronization. Gaps may indicate waiting, Python overhead, compilation or networking rather than insufficient device compute.
Correct timing precedes tuning
GPU operations are usually asynchronous: Python returning does not mean a kernel finished. Use CUDA events or synchronized wall time, and warm up to separate compilation, initialization and cold caches. Do not call CUDA synchronization for CPU-only execution. The notebook selects timing by device and records distributions and environment.
# Requires CUDA/Nsight and your prepared bench.py.
nsys profile --trace=cuda,nvtx,osrt -o baseline python bench.py
ncu --set basic --target-processes all python bench.py
Profiling adds overhead; detailed kernel collection may replay execution. Separate profiling windows from normal performance runs instead of presenting instrumented time as user latency.
Turn observations into falsifiable hypotheses
CPU gaps between decode steps suggest investigating dispatch or compatible graph execution. A long NCCL tail suggests buckets, overlap or a slow rank. Near-saturated effective HBM bandwidth with low compute utilization suggests reuse, precision or cache traffic. Change one major factor and remeasure end-to-end quality and latency.
For TPU/JAX, account for compilation, asynchronous dispatch and block_until_ready(). Compiled HLO/fusion boundaries need not correspond one-to-one with framework operators; map them back to source computations.
Check your understanding
Question: Detailed profiling makes the model five times slower. Is that a regression?
Answer
Not enough evidence. Exclude collection overhead, replay and altered synchronization. Establish actual performance with a stable uninstrumented benchmark, then use traces to explain it.Actual output from this run
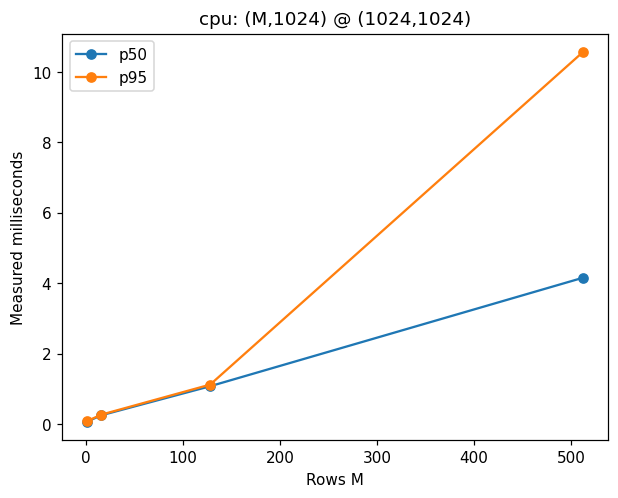
CPU matmul timings measured during authoring, p50/p95 over 20 repeats. These are not GPU or TPU benchmarks.
Primary sources and further reading
Sources checked on 2026-09-10. Teaching examples are not production benchmarks; confirm APIs and model support against the linked version.