A complete explanation from first principles
Account for the complete request path
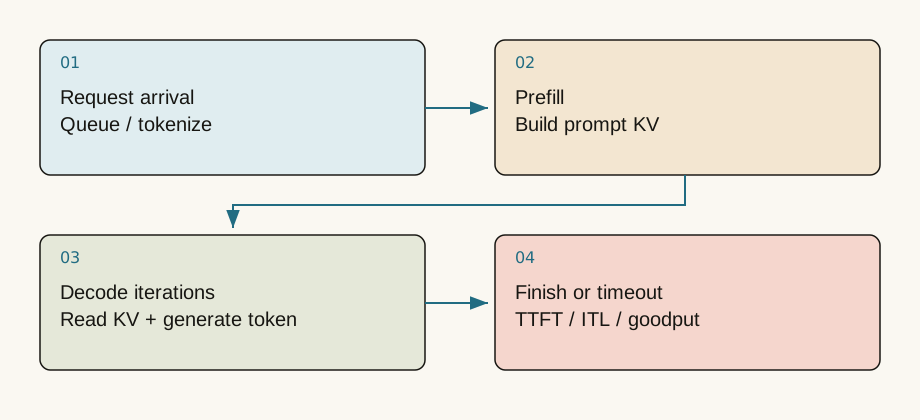
A request can spend time queueing, tokenizing, entering a batch, prefilling its prompt, decoding successive tokens and transferring output to the client. User-visible latency includes all of those stages, not just accelerator kernels.
TTFT measures time to the first token. ITL describes gaps between subsequent tokens. For N output tokens, a rough relation is total ≈ TTFT + (N-1)*mean ITL. Define the boundaries consistently, including networking and buffering. Internal engine timestamps and client-observed timestamps measure different things.
Prefill and decode expose different execution patterns
Prefill processes several known prompt positions together, providing matrix operations with more parallel work. Decode must choose a token before advancing to the next step. A single request therefore supplies few new positions per iteration and may reuse weights less effectively. Batching decode improves reuse while consuming additional KV memory and affecting queues.
“Compute-heavy prefill, bandwidth-heavy decode” is a useful starting intuition, not a universal law. Long-context attention, MoE communication and small-batch launch overhead can dominate particular workloads.
Keep separate weight and runtime ledgers
Seven billion parameters at two bytes each require about 14 GB, or 13.0 GiB, for weights alone. Runtime also needs KV caches, activations, communication buffers and allocator headroom. Fitting the checkpoint does not establish that several long requests will fit.
For a fixed architecture, KV use is approximately proportional to accumulated tokens across active sequences. Change length and concurrency in the notebook to inspect this relationship. A maximum supported length of 32k does not imply unlimited concurrency at 32k.
Queueing can dominate a fast kernel
Under stable and consistently defined observation conditions, an arrival rate of ten requests per second and average system residence time of two seconds imply about twenty in-flight requests by Little's Law. This relates traffic, residence time and concurrency; it does not guarantee capacity. Queueing can rise sharply as offered load approaches service capability.
Closed-loop clients wait for each response before sending another request. Open-loop tests send according to a configured arrival process. Closed-loop testing may reduce offered load when the service slows, concealing overload. State the mode and include failures, timeouts and rejections instead of reporting only fast successful requests.
Throughput and responsiveness can conflict
Larger batches may improve total tokens per second while delaying a new short request behind a long prefill. Chunked prefill divides a long prompt into scheduling units to help balance first-token and ongoing-decode behavior. Appropriate chunk sizes depend on workload measurements. Maximum accelerator utilization is not the same objective as acceptable user-facing tail latency.
Define a service-level objective from product needs, then hold model, precision, hardware and length distributions fixed while sweeping concurrency. Record throughput, p50/p95 TTFT, ITL, peak memory and errors. Identify configurations meeting both quality and latency constraints. The browser's Python-loop timing exercise teaches warmup and repeated measurement; it is not a benchmark ranking of GPU serving frameworks.
Begin with user-visible latency
Time to first token includes queueing, preprocessing, prefill and first-output overhead. Later token latency is often described by ITL or TPOT; record the exact denominator convention. High throughput does not guarantee responsiveness, particularly as queueing rises near capacity.
Prefill performs matrix operations over many tokens and often has higher arithmetic intensity. Small-batch decode generates few tokens per step and is frequently limited by weight and KV reads. This is a tendency, not a universal classification: batch size, context length, parallelism and hardware change the bottleneck.
Budget with KV heads
For conventional MHA/GQA/MQA, approximate cache bytes are . The factor two is K plus V, and s is bytes per element. With 32 layers, 8 KV heads, dimension 128, 4096 tokens, four concurrent sequences and FP16, KV occupies 2 GiB. Exclude weights, workspace, activations and page slack from that number. Architectures such as MLA need a different model.
Use the calculator to change concurrency, length and head count. It estimates storage, not device performance. Quantized caches may require extra scales and specific kernels. Do not allocate every byte of device memory to the estimate.
Three different optimizations
Continuous batching admits and retires requests at iteration boundaries. Paging maps logical token blocks to physical cache blocks, reducing reservation and fragmentation. Prefill/decode separation isolates execution stages into resource pools but introduces KV transfers, routing and capacity-balancing costs. These techniques can coexist; none guarantees acceleration for every workload.
Experiment and check
Run the notebook's actual matmul benchmark after warm-up, then compare serving concurrency with fixed prompt/output lengths. Record p50/p95 TTFT, ITL, completed throughput, error rate and peak memory. Failed requests must remain visible in the denominator.
Question: Tokens/s increases but p95 TTFT doubles. Is the optimization successful?
Answer
That depends on the service objective. Device utilization may improve while queueing worsens. Compare goodput satisfying latency and error constraints, not raw throughput alone.Primary sources and further reading
Sources checked on 2026-09-10. Teaching examples are not production benchmarks; confirm APIs and model support against the linked version.
INTERACTIVE LAB · LIVE NUMERICAL COMPUTATION
KV-cache memory budget
Assume 32 layers, head dimension 128 and 2 bytes per FP16/BF16 element. KV only: weights, activations, page slack and runtime workspaces are excluded.
2 × B × T × L × Hkv × Dh × bytes
One KV head reduces cache, but changing head count is an architecture choice, not a lossless serving toggle. Per-device memory also depends on whether KV heads are replicated.