A complete explanation from first principles
Why positions need to exchange information
Imagine a network that transforms each token independently and never lets positions communicate. Resolving a pronoun or relating a verb to a distant subject would be difficult because the necessary context is elsewhere. Attention supplies a learned reading operation: a position issues a query, scores visible positions and aggregates the information they carry. It makes contextual dependence expressible; it does not guarantee correct reasoning.
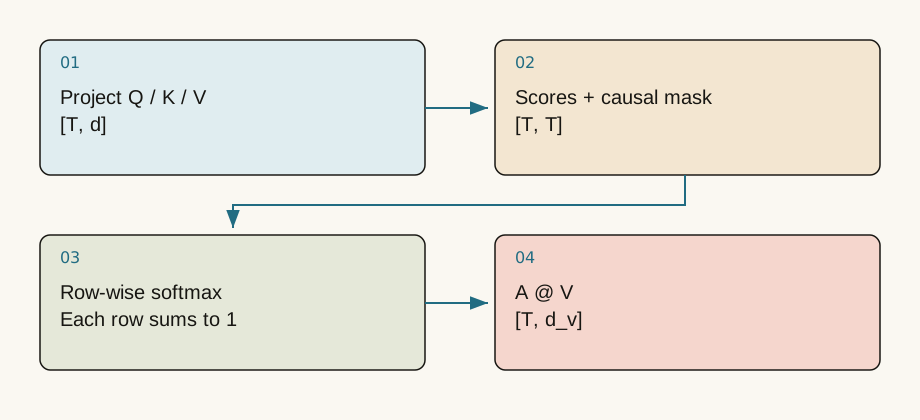
Q, K and V are not three separate input sentences. They are projections of the input representation through three parameter matrices. If X has shape [T,d_model] and W_Q has shape [d_model,d_k], then X @ W_Q has shape [T,d_k]. Keys share the query dimension to support dot products. Values may have a different feature dimension because they carry the content being aggregated.
Calculate one attention row by hand
Let the query be [1,0], the keys [1,0] and [0,1], and the values [10,0] and [0,20]. The dot products are [1,0]. Dividing by the square root of two gives approximately [0.707,0]. Exponentiating produces [2.028,1]; normalization gives weights [0.670,0.330]. The weighted value sum is approximately [6.70,6.60].
import math
scores = [1/math.sqrt(2), 0.0]
z = [math.exp(s-max(scores)) for s in scores]
a = [v/sum(z) for v in z]
values = [[10,0], [0,20]]
out = [sum(a[j]*values[j][d] for j in range(2)) for d in range(2)]
print('weights =', a, 'output =', out)
Change the first value to [100,0]. The weights remain unchanged, while the output changes. This separates two questions: where to read, and what information is retrieved. An attention output is neither a key nor the weight vector itself.
Causality is an information boundary
In autoregressive training, a position predicts a future token without reading that answer. With four positions, the first query has one legal key, the second has two, and the final query has four. Illegal scores are replaced by negative infinity before softmax, so their exponentials become zero.
A subtle implementation problem arises if every key in a row is masked. Softmax over all negative infinities is numerically undefined. The implementation must ensure a valid key exists or explicitly handle fully masked rows. Combining padding and causal masks is a common source of this problem. Libraries also differ in whether a Boolean True means allowed or blocked; check the specific API rather than assuming a universal convention.
Heads and sequence length
Multiple heads use different learned projections to read in different representation subspaces. A model width of 512 with eight heads often uses a key dimension of 64 per head. Outputs are concatenated along the feature axis and projected back to the model width. A head is not guaranteed to specialize in grammar or sentiment; any such interpretation needs evidence.
The dense score matrix contains T*T elements. Increasing sequence length from 1,024 to 4,096 multiplies its size by sixteen. This explains one source of long-context pressure. It does not prove that end-to-end serving becomes sixteen times slower: batching, memory traffic and kernel choices also affect runtime.
Read heatmaps as measurements, not explanations
Each row is a query's distribution over key columns. Verify axis direction, masks and row sums before interpreting a bright square. High weight is not the same as causal importance. Value magnitudes, output projections, residual paths and subsequent layers all influence the eventual prediction. Replacement or ablation experiments can test influence, but those interventions may also move inputs away from the training distribution.
The notebook plots actual computed weights. Before running it, predict what happens when every legal score receives the same constant or when temperature increases. Comparing a written prediction with the output is a better test of understanding than recognizing the visual pattern after it appears.
A weighted lookup
A query describes what a position seeks, a key describes how a position can be matched, and a value contains the information to aggregate. This is a role analogy, not a claim that individual dimensions have human-readable meanings. Different learned projections usually produce all three from the input.
With and , first compute with shape [T,T]. Normalize each row into A, then compute with shape [T,d_v]. Weight describes how position i reads value j. It is not a causal explanation of an answer.
Why the square root?
If q and k dimensions are approximately independent, zero-mean and unit-variance, their dot-product variance grows with . Dividing by its square root stabilizes the score scale and reduces early softmax saturation. This is a numerical motivation, not a theorem about every learned distribution.
scores = q @ k.transpose(-2, -1) / q.shape[-1]**0.5
future = torch.ones(T, T, dtype=torch.bool).triu(1)
scores = scores.masked_fill(future, float('-inf'))
weights = scores.softmax(dim=-1)
out = weights @ v
This fragment assumes PyTorch tensors q/k/v and sequence length T; the notebook supplies a runnable version. Zeroing future weights after softmax without renormalizing produces rows summing below one and changes the operation.
Mask and temperature experiment
The experiment fixes four two-dimensional Q/K vectors. Predict the first row under causal masking, then disable the mask. With one legal key, the first row is always [1,0,0,0], regardless of temperature. Increasing temperature makes weights more uniform over legal positions; it must not leak into future positions.
We display a full matrix for teaching. A production implementation should avoid storing all entries per layer and head when possible. FlashAttention reorganizes memory access using tiles while targeting exact attention; it does not simply discard low weights.
Check your understanding
Question: Does adding 100 to every legal score in each row change the result?
Answer
No, mathematically. Softmax is invariant to a uniform row-wise shift. Implementations usually subtract the maximum to avoid exponential overflow. Different biases for different columns do change the distribution.Primary sources and further reading
Sources checked on 2026-09-10. Teaching examples are not production benchmarks; confirm APIs and model support against the linked version.
INTERACTIVE LAB · LIVE NUMERICAL COMPUTATION
What does each attention row distribute?
Fixed Q=K=[[1,0],[0,1],[1,1],[-1,0.5]]. Observe softmax(QKᵀ/√2/T). These are teaching vectors, not extracted model attention.
| Q / K | t0 | t1 | t2 | t3 |
|---|---|---|---|---|
| t0 | 1.000 | 0.000 | 0.000 | 0.000 |
| t1 | 0.330 | 0.670 | 0.000 | 0.000 |
| t2 | 0.248 | 0.248 | 0.503 | 0.000 |
| t3 | 0.098 | 0.283 | 0.139 | 0.480 |
Try removing the mask: the first token can now see the future. Near zero temperature, mass concentrates on the largest scores; ties still share it.